With the release of Arduino IDE v1.6.6, a new tool was given to the users called the Serial Plotter. The idea of it is to be able to visualize the data you return, beyond just seeing numbers spit out onto the serial monitor. I’m a big fan of anything that lets people conceptualize the data their receiving in intuitive ways, so having a convenient graph generator in your IDE should be great.
What The Arduino Serial Plotter Is
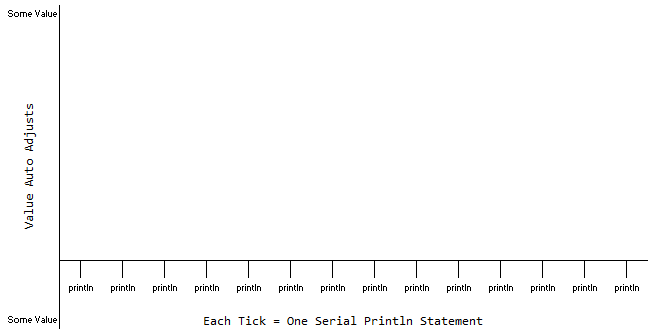
The Arduino Serial Plotter is, as the name suggests, a software utility within the IDE that takes incoming serial values over the USB connection. Instead of just displaying the raw values to a TTY monitor, it graphs them against an X/Y axis. The vertical Y axis auto adjusts as the value of your output increases or decreases, and the X axis is a fixed 500 point axis with each tick of the axis equal to an executed serial println command.
The plotter updates each time the serial line pops with a new value, which is to say, it updates slowly. Well, slow from a microprocessor standpoint.
Testing the Serial Plotter
We’ll start off by copying the example sketch that was displayed in the promo graphic for the release of v1.6.6.
|
1 2 3 4 5 6 7 8 9 10 11 12 13 14 15 16 17 18 19 20 21 22 23 24 25 |
#include "math.h" // This will allow us to run the "sin" function. void setup() { // Enable Serial Output Serial.begin(9600); while (!Serial); } void loop() { // Describe the upward swing of the sine wave for (double i = -1.0; i <= 1.0; i = i + 0.1) { Serial.println (sin(i)); delay(10); } // Describe the downward swing of the sine wave for (double i = 1.0; i >= -1.0; i = i - 0.1) { Serial.println (sin(i)); delay(10); } } |
Upload that sketch using v1.6.6 and then open the serial plotter by either clicking on Tools / Serial Plotter or pressing CTRL+SHIFT+L (on windows).
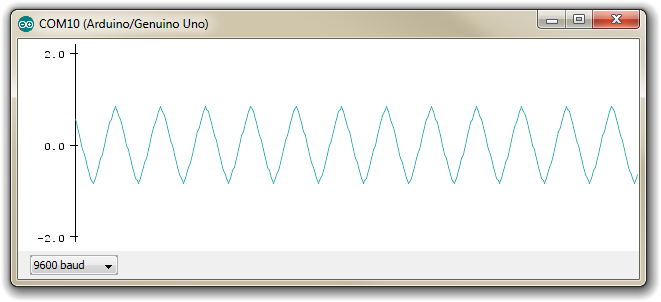
After the plotter opens up, you’ll see the sine wave begin to be drawn between -1.0 and 1.0 and back again. The function used in the sketch describes 20 values on the way up to to 0.84 and 20 values on the way back down to -0.84… 40 points to be plotted per duty cycle.
As soon as the plot hits the right edge of the window, it starts scrolling from right to left, and this is the first problem I have with it… there’s no way to stop it. There’s no “uncheck autoscroll” to buffer the values outside the display like there is in the serial monitor. If Serial.println(); keeps hammering away, your data scrolls off the left side of the graph without you able to do a thing about it.
Serial Plotter X Axis
The X axis is a fixed axis with each value representing one output of the Serial.println(); function. There is no time scale to speak of, really.
Along with that limitation, is the fact that the displayed axis is fixed at 500 points. It doesn’t matter how large or small you make your window, it’s still 500 points. Period. Sort of like a shift registers, when data point 501 shows up, data point 1 is lost. And since there’s no way to stop the plot from scrolling, you’ll need to compensate for this in your code.
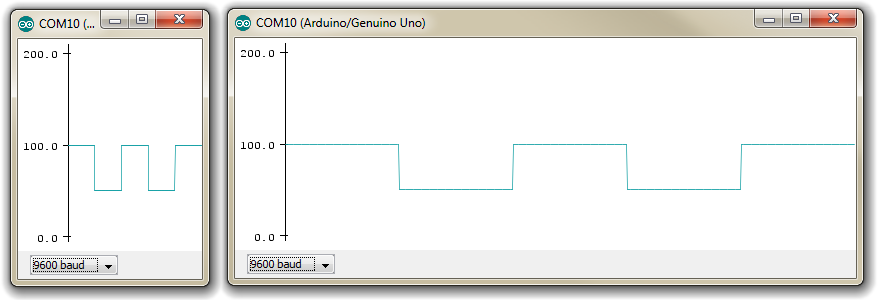
To show what I mean, this sketch will generate a square wave from 100 to 50 to 100 to 50, and do it 5 times. Note that all the work happens in Setup as a crude way of ensuring it only executes once.
|
1 2 3 4 5 6 7 8 9 10 11 12 13 14 15 16 17 18 19 20 21 22 23 24 25 26 27 28 29 30 31 |
void setup() { Serial.begin(9600); while (!Serial); for (int i = 0; i < 100; i++) { Serial.println (100); // Data Points 0 - 99 } for (int i = 0; i < 100; i++) { Serial.println (50); // Data Points 100 - 199 } for (int i = 0; i < 100; i++) { Serial.println (100); // Data Points 200 - 299 } for (int i = 0; i < 100; i++) { Serial.println (50); // Data Points 300 - 399 } for (int i = 0; i < 100; i++) { Serial.println (100); // Data Points 400 - 499 } } void loop() { } |
It doesn’t matter how the window is resized, the same 500 data points display regardless.
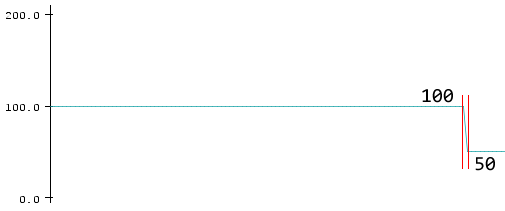
A particularly annoying issue that arises from having this fixed axis with no tick marks or indicating lines, is that you have no reference as to when something was measured. Look closely at the transition between 100 to 50. You can tell from the code that there is no middle value… no 75, no 94. But if you expand the graph…
Without knowing when the values were measured, it’s not really possible tell from the plot if the transition was sharp and digital, or if it was fuzzy and analog.
Another problem is that the serial monitor and the serial plotter cannot be run simultaneously. It’s either one or the other.
Plotting Real World Data
So how can this be used in the real world?
In the I2C and SPI Education Series, I cover using the ADC to measure audio input signals at various sample rates.
- MCP3008 Tutorial 04: Sampling Audio Frequency Signals 01
- MCP3008 Tutorial 05: Sampling Audio Frequency Signals 02
So by hooking up the I2C and SPI Education Shield to an audio source, and loading up some of that code again, I should be able to plot the values using the serial plotter, instead of having to copy them out of the serial monitor and into Excel as I did when I wrote those tutorials back in April.
In a moment of glorious serendipity, it turns out the final code I wrote for measuring a 660Hz signal grabbed 500 data points by default, so we should be able to graph this without any overflow or scrolling.
I encourage you to go check out those links above to understand exactly how everything was setup, but essentially it’s a 660Hz signal source, connected through a very simple biasing circuit to allow the Arduino to measure the signal in a 0-5V range instead of chopping off all signal below 0V.
Of note, this is the code that records the 500 samples first, then sends the output to the serial lines, rather than chopping up the sampling rate with a bunch of clunky and slow Serial.println(); commands. It also makes use of PORT commands instead of digitalWrite(); to generate as many samples as fast as possible.
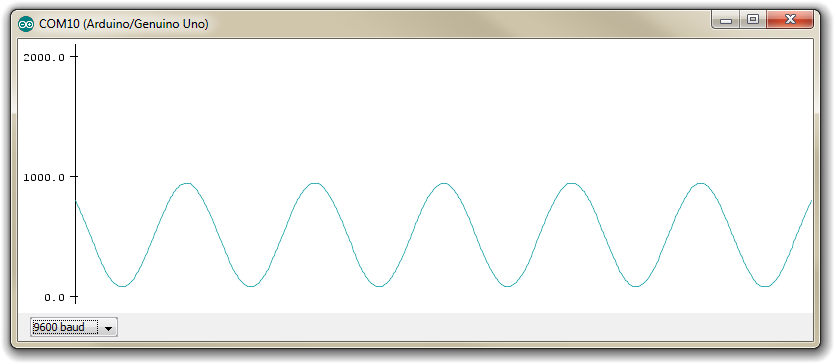
The end result, is actually pretty cool. Connect the Education Shield (or the MCP3008 Breakout Board) as described in those tutorials linked above to the signal source, upload this sketch and open the serial plotter.
|
1 2 3 4 5 6 7 8 9 10 11 12 13 14 15 16 17 18 19 20 21 22 23 24 25 26 27 28 29 30 31 32 33 34 35 36 37 38 39 40 41 42 43 44 45 46 47 48 49 50 51 52 53 54 55 56 57 58 59 60 61 62 63 64 65 66 67 68 69 70 71 72 73 74 75 76 77 78 79 80 81 |
/* A sketch to control the 10-Bit, 8-channel ADC MCP3008 on the Rheingold Heavy I2C and SPI Education Shield at speeds necessary to sample an audio frequency signal. This code specifically uses PORT commands to toggle the ADC chip select pin, instead of using digitalWrite(); The code supposes the use of the Education Shield, but if you're using a breakout board, connect the CS pin to Digital 4, and the SPI pins in their usual locations. Website: https://rheingoldheavy.com/mcp3008-tutorial-05-sampling-audio-frequency-signals-02 Datasheet: http://ww1.microchip.com/downloads/en/DeviceDoc/21295d.pdf */ #include <SPI.h> // Include the SPI library SPISettings MCP3008(2000000, MSBFIRST, SPI_MODE0); const int CS_MCP3008 = 4; // ADC Chip Select const byte adc_single_ch0 = (0x08); // ADC Channel 0 const byte adc_single_ch1 = (0x09); // ADC Channel 1 const byte adc_single_ch2 = (0x0A); // ADC Channel 2 const byte adc_single_ch3 = (0x0B); // ADC Channel 3 const byte adc_single_ch4 = (0x0C); // ADC Channel 4 const byte adc_single_ch5 = (0x0D); // ADC Channel 5 const byte adc_single_ch6 = (0x0E); // ADC Channel 6 const byte adc_single_ch7 = (0x0F); // ADC Channel 7 void setup() { SPI.begin (); Serial.begin (9600); pinMode (CS_MCP3008, OUTPUT); digitalWrite (CS_MCP3008, LOW); // Cycle the ADC CS pin as per datasheet digitalWrite (CS_MCP3008, HIGH); delay(100); int adc_reading[500]; SPI.beginTransaction (MCP3008); for (int i = 0; i < 500; i++) { adc_reading [i] = adc_single_channel_read (adc_single_ch7); } SPI.endTransaction (); for (int i = 0; i < 500; i++) { Serial.println (adc_reading[i]); } } void loop() { } int adc_single_channel_read(byte readAddress) { byte dataMSB = 0; byte dataLSB = 0; byte JUNK = 0x00; //digitalWrite (CS_MCP3008, LOW); PORTD = PORTD & 0xEF; SPI.transfer (0x01); // Start Bit dataMSB = SPI.transfer(readAddress << 4) & 0x03; // Send readAddress and receive MSB data, masked to two bits dataLSB = SPI.transfer(JUNK); // Push junk data and get LSB byte return PORTD = PORTD | 0x10; //digitalWrite (CS_MCP3008, HIGH); return dataMSB << 8 | dataLSB; } |
Because the sampling rate is significantly high, the output on the serial plotter looks appropriately gorgeous…
Unfortunately, because there’s no time scale listed, and no detail on the y-axis, you can’t really see into that signal to understand that it is a 660Hz representation. For all you know, it could be a 1Hz representation measured very slowly, since each tick represents not the sine wave, but a print command value.
Serial Plotter Bottom Line
Well, I think that it’s definitely a first version of what could eventually become a very useful utility. Using it right now requires a few items to be kept foremost when writing code to use the plotter.
- Strangely, they released a feature they thought was so cool that they used it in their promotional blog announcement, but published zero documentation for it that I can find. There’s nothing in the official language reference for certain, and the release notes only state that it exists.
- Only output numerical values. Non-number values (ie: text) aren’t displayed.
- Be mindful of the 500 point limit. If necessary, build support into your sketch that will allow you to halt / pause execution so you can see a specific plot at a specific time. The most definitive way to do that would be with an interrupt service routine.
- Remember that there’s no time scale, so the elapsed time between plot point 98 and plot point 99 could be 6.25ms or it could be 6.25 days. There’s no way to tell.
- You can’t open the serial monitor simultaneously with the serial plotter. It’s one or the other. You won’t be able to keep both open to read the exact value being displayed on the plotter.
- Since the plotter uses the USB to Serial Subsystem, that means your Arduino will reset each time you open it.
