Pretty much every single product page out there, and consequently every tutorial, always quote the “readout is 10% decay” statistic from the datasheet, but no one ever bothers to explain it. Well, let me correct that.
MSGEQ7 Decay Rate Definition
The MSGEQ7 decay rate is the speed with which the output representing a particular frequency band will drop, if the peak detector determines that the current value is lower than the previous value — it’s like climbing a ladder quickly to the top of a platform then taking the stairs down. The decay rate determines how steep those stairs are.
The MSGEQ7 datasheet says that the value decays 10% per read. It’s not clearly expressed anywhere in the datasheet exactly what value is being used to calculate the 10% reduction. If your highest level as read by the ADC is 1000, then you would expect the next reading to be 900. But what about the next one, would it be the original 10% again, 100, or 10% of 900, 90. My bet is that’s its a running 90% value, just decaying whatever the most recently provided value was… in that example, 90.
So, in essence, what we would expect to see would be something like this, assuming we max out the value to 5V to achieve a 1023 reading on the ADC, and also achieve exact 10% decay per subsequent reading…

So how do we test this assumption?
MSGEQ7 Decay Rate Test Code
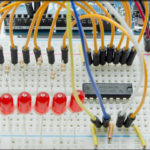
What I’m doing is connecting the chip to my Arduino, just as I did in the first MSGEQ7 tutorial, only this time, I’m also connecting a debounced button to use as a trigger for the Arduino, telling it to go and grab the current reading for me, instead of just simply streaming it back.

Here’s the test methodology…
- Prepare the code to listen to one specific frequency channel, I chose 400Hz, the third band.
- Find a crisp 400Hz signal. YouTube has one easily used: https://www.youtube.com/watch?v=33qV3d3U0q4
- Upload the code and launch the serial monitor. Press the button to take a few samples with nothing playing to establish a baseline. You are expecting a value below 100. If not, make sure no other audio sources are playing on your PC.
- Launch the clear 400Hz tone. Press the button to take another sample. You are expecting a reading close to 1023. If not, try turning the volume of your PC up. You won’t damage the MSGEQ7.
- Stop the 400Hz tone.
- With the 400Hz band essentially quiet now, press the button several more times to gather values on a quiet channel, immediately after a maxed channel.
Here’s the code.
|
1 2 3 4 5 6 7 8 9 10 11 12 13 14 15 16 17 18 19 20 21 22 23 24 25 26 27 28 29 30 31 32 33 34 35 36 37 38 39 40 41 42 43 44 45 46 47 48 49 50 51 52 53 54 55 56 57 58 59 60 61 62 63 64 65 66 67 68 69 70 71 72 73 74 75 76 77 78 79 80 |
/* A sketch designed to explore the decay rate of the MSGEQ7. It is highly recommended that you open the youtube video "400 Hz Sine Wave Sound Frequency Tone" and connect your computer's headphone output to the Rheingold Heavy MSGEQ7 3.5mm stereo jack. You will also want a very clean button signal to advance the readings. This sketch expects the following pin assignments... STROBE = DIGITAL 7 RESET = DIGITAL 8 OUTPUT = ANALOG 5 Website: https://rheingoldheavy.com/msgeq7-tutorial-02-decay-rate Datasheet: http://www.mix-sig.com/images/datasheets/MSGEQ7.pdf 400Hz Tone on YouTube: https://www.youtube.com/watch?v=33qV3d3U0q4 */ int strobePin = 7; int resetPin = 8; int outPin = A5; int button = 4; int level[7]; void setup() { Serial.begin(9600); pinMode (strobePin, OUTPUT); pinMode (resetPin, OUTPUT); pinMode (outPin, INPUT); pinMode (button, INPUT); digitalWrite (resetPin, LOW); digitalWrite (strobePin, LOW); delay(1); digitalWrite (strobePin, HIGH); delay(1); Serial.println ("Press button to initiate sample..."); } void loop() { int buttonPress = 1; while (digitalRead(button) == HIGH) { if (buttonPress == 1) { buttonPress = 0; readLevels(); } } } void readLevels() { digitalWrite (resetPin, HIGH); delay(1); digitalWrite (resetPin, LOW); delay(1); for (int i = 0; i < 7; i++) { digitalWrite (strobePin, LOW); delay (1); level[i] = analogRead (outPin); digitalWrite (strobePin, HIGH); delay (1); } Serial.print ("Reading from 400Hz frequency band: "); Serial.println (level[2]); Serial.println (); Serial.println ("Press button again to reread..."); } |
After uploading the code and following the methodology, here is what the actual returned values where.

Pretty close to our original graph!
This is used to give the very nice “staggered return” to zero on a graphic equalizer display, where the audio peaks, but you see the LED bar graph crawl back to the bottom instead of just immediately falling.