So far we’ve done simple measurements of DC signals. What if those signals aren’t just static DC, but are actually changing, and changing really fast? How do we accurately measure that?
Objectives
- Understand how the test signal is generated.
- Understand what is meant by biasing a signal.
- Prepare the SPISettings object for use in your code.
- Determine how to quickly increase the sampling speed of your Arduino code.
Background
MCP3008 Functionality Overview
Arduino SPI Library
Microchip MCP3008 Datasheet
Schematic
Education Shield – MCP3800 ADC Subsystem
Setup
For this module, you’ll need the following equipment:
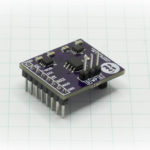
- I2C and SPI Education Shield or the MCP3008 Breakout Board
- Arduino UNO R3
1. Mate the Education Shield with your Arduino UNO R3. If you’re using the MCP3008 Breakout Board, connect 5V to 5V, 3V3 to 3.3V, GND to GND, AGND to GND, CS to Digital4, MOSI to Digital11, MISO to Digital12, and CLK to Digital13. That’s a lot of pins!
2. Connect your Arduino to your USB cable, and use the Arduino IDE to upload the “Bare Minimum” sketch from the Basics section of the Examples.
Preparing an AC Signal for Sampling with the MCP3008 and an Arduino
We’ve already seen how to perform measurements of a source that barely changes. Even though the voltage level we’re measuring from the potentiometer changes as we turn the knob, we’d have to turn the knob back and forth at super human speeds to start taxing the ability of our MCP3008 to handle it. So what happens when that signal starts oscillating back and forth so rapidly we can’t just measure it accurately with the code we already have? Let’s have a look.
The first thing we need is something to measure. I have the good fortune of having an arbitrary waveform generator (AWG) that I’m going to use to generate the signal. I know that this is outside the scope of what most people have on hand, so I’ll provide an alternative, slightly more hacker friendly solution after.
In both cases, the signal we’re going to receive needs to be centered inside the range we can measure. The ADC has 5V and 3V3 volt available for use, and for this module, I’m going to select 5V. That means our signal needs to be no greater than 5V and no smaller than 0V. The problem is that the signal we’re measuring actually goes into negative voltage, so we need to raise it into the measuring range somehow. This is called biasing the signal, and we’re going to do it with a simple voltage divider and a capacitor.
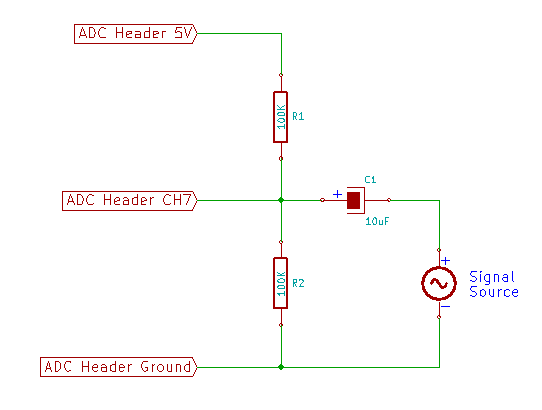
Your signal is fluctuating around some midpoint, which I happen to know for a fact will be 0V. If we tried to measure it, our signal would flatline when we got to zero volts or anywhere below it. This circuit takes that signal and uses a voltage divider with VREF as the high point and AGND as the low point, and two 100K resistors between them. They form a voltage divider, which means the mid point between them will be exactly the midpoint between VREF and AGND. Into this junction, we bring our signal, but first we place the capacitor in the way. As the signal source goes below zero volts, it will pull stored voltage out of the capacitor, dropping the voltage at the midpoint of the voltage divider. As the signal rises, charge builds back up in the capacitor, raising the voltage at the midpoint of the voltage divider. You’re exactly simulating the signal on the source side of the capacitor, but doing it within the range of the voltage divider. Pretty neat. The end result is a signal that will never go below AGND or above VREF. Perfect for measuring.
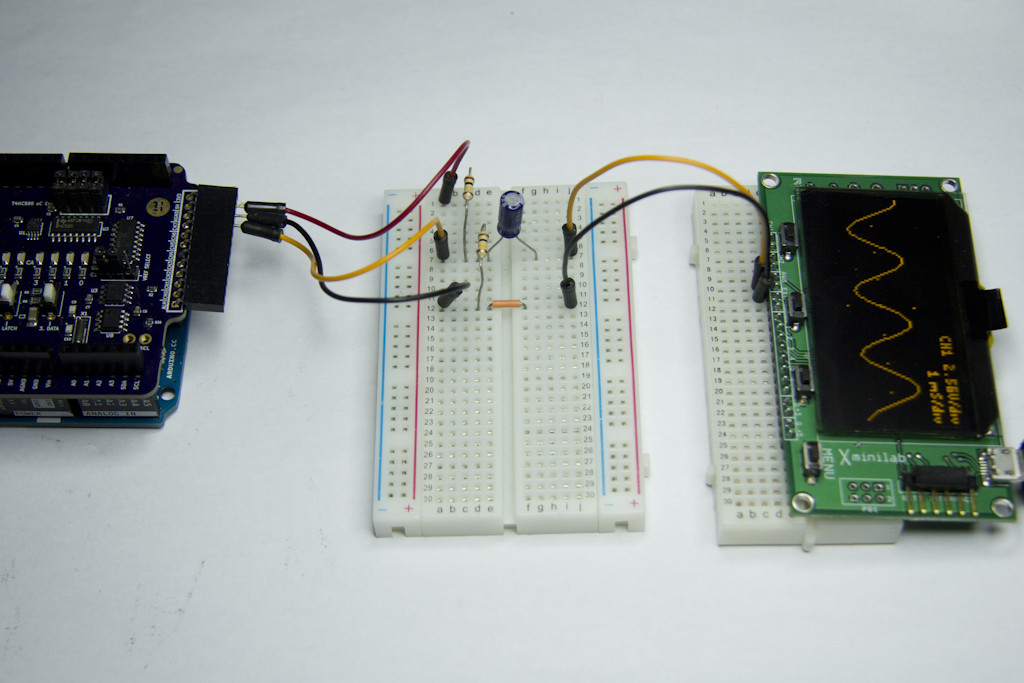
I’m going to select a signal frequency of 660Hz. The 10uF capacitor will be good enough for our needs, since we’re not going to go too crazy with our test frequencies and stick in the audio range. Anything higher and you’d need to start doing some real engineering beyond the scope of this tutorial.
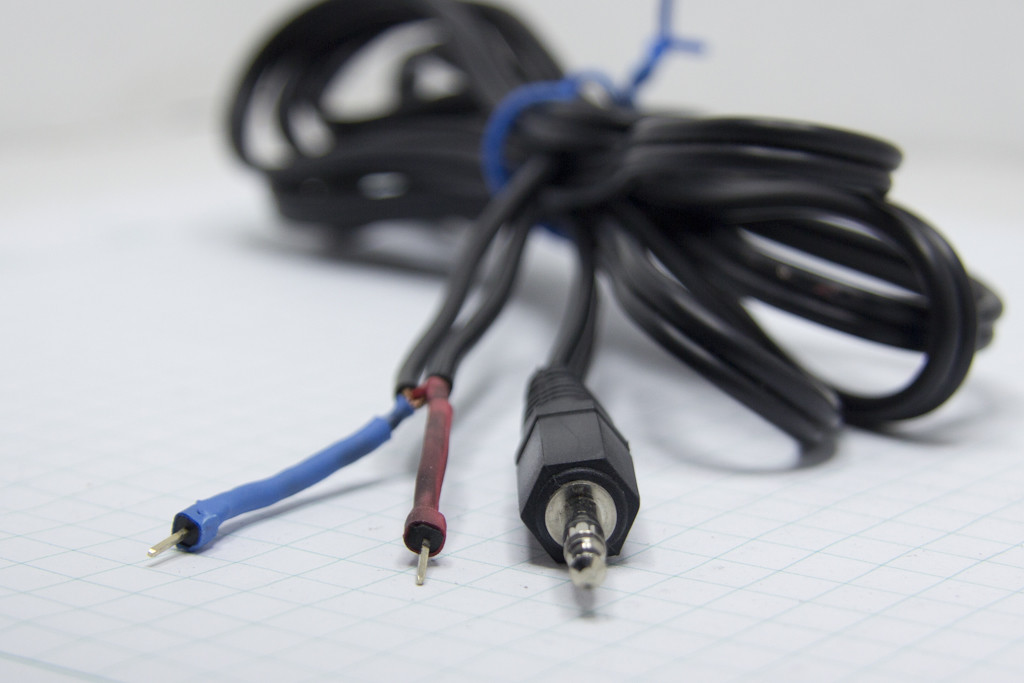
Since not everyone has an AWG, what you can do instead is take a standard 3.5mm audio cable extender and clip off one end. Take the ground wires, twist them together and solder them to a pin header, and take the signal wires, twist them together and solder them to a pin header. Now you can plug that into your computer and pull up a 660Hz test signal on youtube and run that into your little biasing circuit and you’ll be able to follow right along! You’ll probably need to turn the volume up on your audio source all the way in order to get anything other than millivolts of signal. (There are also test tone generator apps for mobile phones you can use.)
With our signal ready to go, it’s time to start measuring.
Modifying our Code
We are going to use our original code from the Sampling DC Voltage Tutorial as a starting point. However, this code was very verbose with it’s output, telling us which channel was being measured, and doing voltage calculations, which we’re not really concerned with at this point. We just want the raw data, 0-1023. Further, we need to do a single discrete capture so that we’re always comparing the same amount of data from one test to the next, so looping infinitely doing measure after measure doesn’t really suit our purposes.
What we need to do, is limit the amount of measurements we take, and output each one to the serial monitor, one per line. This we can then bring into other tools to do some work with it. I’m going to use Excel to do some simple graphs, but you could use Google’s spreadsheet tool as well.
Due to the size of memory we have to deal with, we’re going to limit ourselves to 500 samples, and that’s it. So I’m going to move the command that triggers the SPI interaction that does the sampling into the Setup function, and place it inside a For loop, that will execute the command 500 times. Our main loop will be empty.
Here is the code…
|
1 2 3 4 5 6 7 8 9 10 11 12 13 14 15 16 17 18 19 20 21 22 23 24 25 26 27 28 29 30 31 32 33 34 35 36 37 38 39 40 41 42 43 44 45 46 47 48 49 50 51 52 53 54 55 56 57 58 59 60 61 62 63 64 65 66 67 68 69 70 71 72 |
/* A sketch to control the 10-Bit, 8-channel ADC MCP3008 on the Rheingold Heavy I2C and SPI Education Shield at speeds necessary to sample an audio frequency signal. The code supposes the use of the Education Shield, but if you're using a breakout board, connect the CS pin to Digital 4, and the SPI pins in their usual locations. Website: https://rheingoldheavy.com/mcp3008-tutorial-04-sampling-audio-frequency-signals Datasheet: http://ww1.microchip.com/downloads/en/DeviceDoc/21295d.pdf */ #include <SPI.h> // Include the SPI library SPISettings MCP3008(2000000, MSBFIRST, SPI_MODE0); const int CS_MCP3008 = 4; // ADC Chip Select const byte adc_single_ch0 = (0x08); // ADC Channel 0 const byte adc_single_ch1 = (0x09); // ADC Channel 1 const byte adc_single_ch2 = (0x0A); // ADC Channel 2 const byte adc_single_ch3 = (0x0B); // ADC Channel 3 const byte adc_single_ch4 = (0x0C); // ADC Channel 4 const byte adc_single_ch5 = (0x0D); // ADC Channel 5 const byte adc_single_ch6 = (0x0E); // ADC Channel 6 const byte adc_single_ch7 = (0x0F); // ADC Channel 7 void setup() { SPI.begin (); Serial.begin (9600); pinMode (CS_MCP3008, OUTPUT); digitalWrite (CS_MCP3008, LOW); // Cycle the ADC CS pin as per datasheet digitalWrite (CS_MCP3008, HIGH); delay(100); for (int i = 0; i < 500; i++) { int adc_reading = 0; adc_reading = adc_single_channel_read (adc_single_ch7); Serial.println (adc_reading); } } void loop() { } int adc_single_channel_read(byte readAddress) { byte dataMSB = 0; byte dataLSB = 0; byte JUNK = 0x00; SPI.beginTransaction (MCP3008); digitalWrite (CS_MCP3008, LOW); SPI.transfer (0x01); // Start Bit dataMSB = SPI.transfer(readAddress << 4) & 0x03; // Send readAddress and receive MSB data, masked to two bits dataLSB = SPI.transfer(JUNK); // Push junk data and get LSB byte return digitalWrite (CS_MCP3008, HIGH); SPI.endTransaction (); return dataMSB << 8 | dataLSB; } |
Inspect that, then copy it into the IDE and upload it to the Arduino. Then start your signal running (using an AWG or the Test Tone and Audio Cable hack) and open the serial monitor. You will see values start to stream into it rapidly.
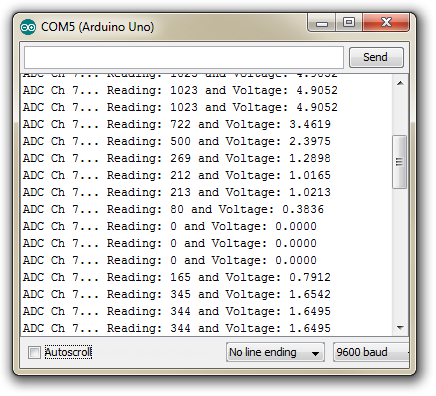
On a windows computer, you click inside the Serial Monitor window and press CTRL+A to select everything, then CTRL+C to copy it to your clipboard. Then you can paste it into your spreadsheet tool of choice.
Here is the graph that I get with the values returned…
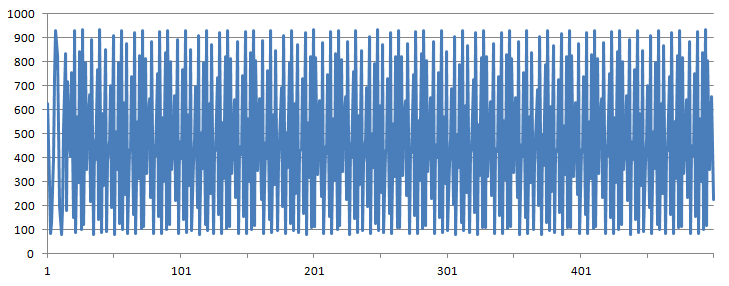
Yuck! It’s just noise! When I pull that signal up on an oscilloscope, thought, it looks like I would expect it to…
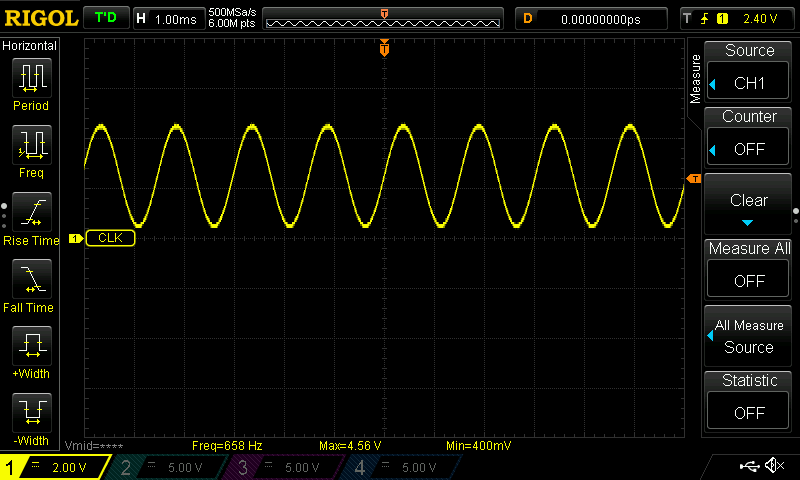
The reason the measurements are all over the place, is because we are sampling far too slowly. Every time we go trigger a sample, we’re hitting the sine wave in some random spot… occasionally the measurement looks sine wave-ish, and there’s definitely a visual “mid-line” to the graph, but it’s just ugly. We need to speed things up.
Speeding Our ADC Measurements Part One
We need to look at the reasons why the code is so slow, compared to a 660Hz signal. All of the measuring is happening in that for loop, and in the adc_single_channel_read function, so those are the places we need to look.
|
1 2 3 4 5 6 7 8 9 10 11 12 13 14 15 16 17 18 |
int adc_single_channel_read(byte readAddress) { byte dataMSB = 0; byte dataLSB = 0; byte JUNK = 0x00; SPI.beginTransaction (MCP3008); digitalWrite (CS_MCP3008, LOW); SPI.transfer (0x01); // Start Bit dataMSB = SPI.transfer(readAddress << 4) & 0x03; // Send readAddress and receive MSB data, masked to two bits dataLSB = SPI.transfer(JUNK); // Push junk data and get LSB byte return digitalWrite (CS_MCP3008, HIGH); SPI.endTransaction (); return dataMSB << 8 | dataLSB; } |
Looking in this function, it’s actually pretty tight. We are only doing as much SPI work as we need to, and we can’t really jettison any of the other commands beyond possibly the SPI.beginTransaction / SPI.endTransaction stuff, because we’re only dealing with one chip. Let’s see if there’s something in the for loop that can be cleaned up instead.
|
1 2 3 4 5 |
for (int i = 0; i < 500; i++) { int adc_reading = 0; adc_reading = adc_single_channel_read (adc_single_ch7); Serial.println (adc_reading); } |
Well, there’s a major culprit right there. Serial commands. In between each and every measurement, we stop everything we’re doing and send some ASCII characters out over the serial port.
Our code says to initialize the Serial port at 9600 baud. Upload this code to your Arduino and open up the serial monitor…
|
1 2 3 4 5 6 7 8 9 10 11 12 13 |
void setup() { // put your setup code here, to run once: Serial.begin(9600); for (int i = 0; i < 500; i++) { Serial.println (millis()); } } void loop() { // put your main code here, to run repeatedly: } |
All that code does, is output the current amount of elapsed time in milliseconds since the program started running. You can see that you’re averaging about 6-7ms every time you send a message to the serial window, and to send 500 of them takes 2.742 seconds! With a 660Hz signal, 2.742 seconds means 1809 oscillations, and we only sampled it 500 times! No wonder it looks crappy. Even if you go to the fastest serial speed of 115200 baud, it will still take 172ms. This is what our graph looks like with the serial speed boosted all the way up to 115200 (to do this, change the serial.begin command to 115200 instead of 9600 and change it in the settings of the serial monitor window).
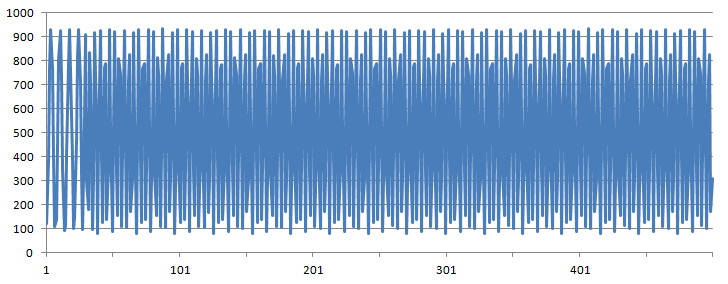
Well, it looks better, I suppose. We’ve pulled the signal apart a little bit and are starting to see discrete peaks and valleys, not as random anymore, but it’s still no where near sufficient. We need to take the serial output out of the measurement loop.
This can be done simply enough. Instead of writing to the serial window, let’s write to a buffer instead. Our data size is 10 bits so we’ll need to use an integer type variable, and since we’re taking 500 measurements, we’ll create an integer array with 500 elements to it.
Then inside the for loop, instead of directing our output to the serial window, we’ll write it to the buffer instead. Then we’ll use a second for loop to do all the serial work and write the contents of the buffer to the serial monitor.
This is the new setup function and contains all the changes necessary to the original ADC code…
|
1 2 3 4 5 6 7 8 9 10 11 12 13 14 15 16 17 18 19 20 21 22 |
void setup() { SPI.begin (); Serial.begin (9600); pinMode (CS_MCP3008, OUTPUT); digitalWrite (CS_MCP3008, LOW); // Cycle the ADC CS pin as per datasheet digitalWrite (CS_MCP3008, HIGH); delay(100); int adc_reading[500]; for (int i = 0; i < 500; i++) { adc_reading [i] = adc_single_channel_read (adc_single_ch7); } for (int i = 0; i < 500; i++) { Serial.println (adc_reading[i]); } } |
You can see that the serial output has been separated from the sampling mechanism. Considering that we only sampled 1800 oscillations 500 times before, this should prove to be a big improvement, because it’s not standing in the way of the SPI mechanics anymore.
And here is the graph of the 660Hz signal using the new code…
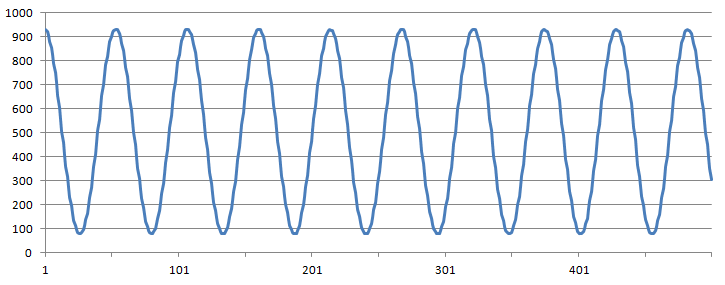
Whoa! Look at that! A sine wave has emerged from the junk! The reason is that we’re sampling the signal much, much faster. How much faster you ask? Well, if we just change the code a wee bit so that we return the millis value from the adc_single_channel_read function instead of the actual reading, that will tell us how fast we’re sampling, and the result is, about 35 samples per millisecond! That’s a sampling rate of 35ksps (also called 35kHz) just by moving the serial commands out of our measuring system. CDs audio is sampled at a rate of 44.1khz so that’s not too bad. (CDs audio is also sampled at 24 bits, not 10 bits, so we’re not going to be taking our Arduino to the philharmonic to make recordings anytime soon.)
Ok, so we’ve got
